

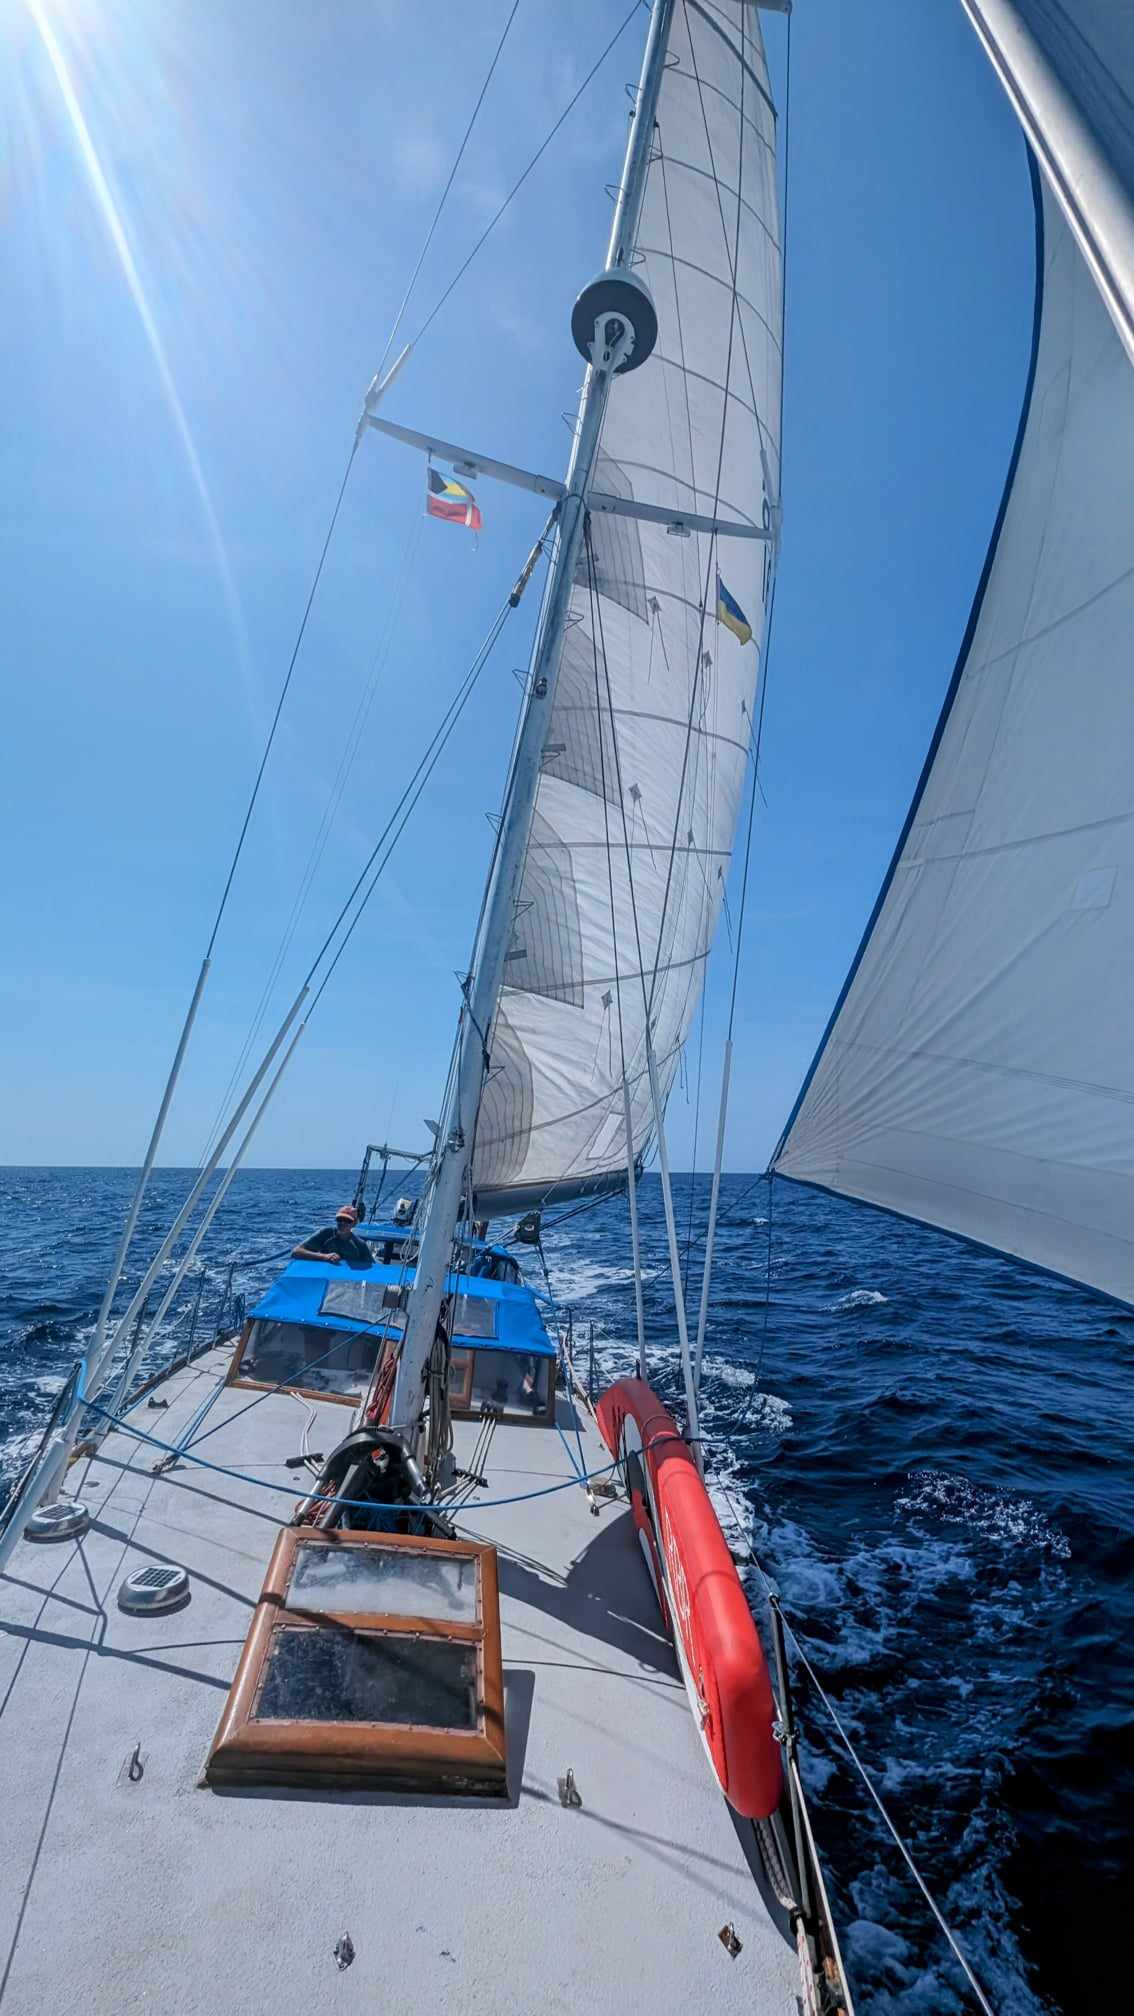
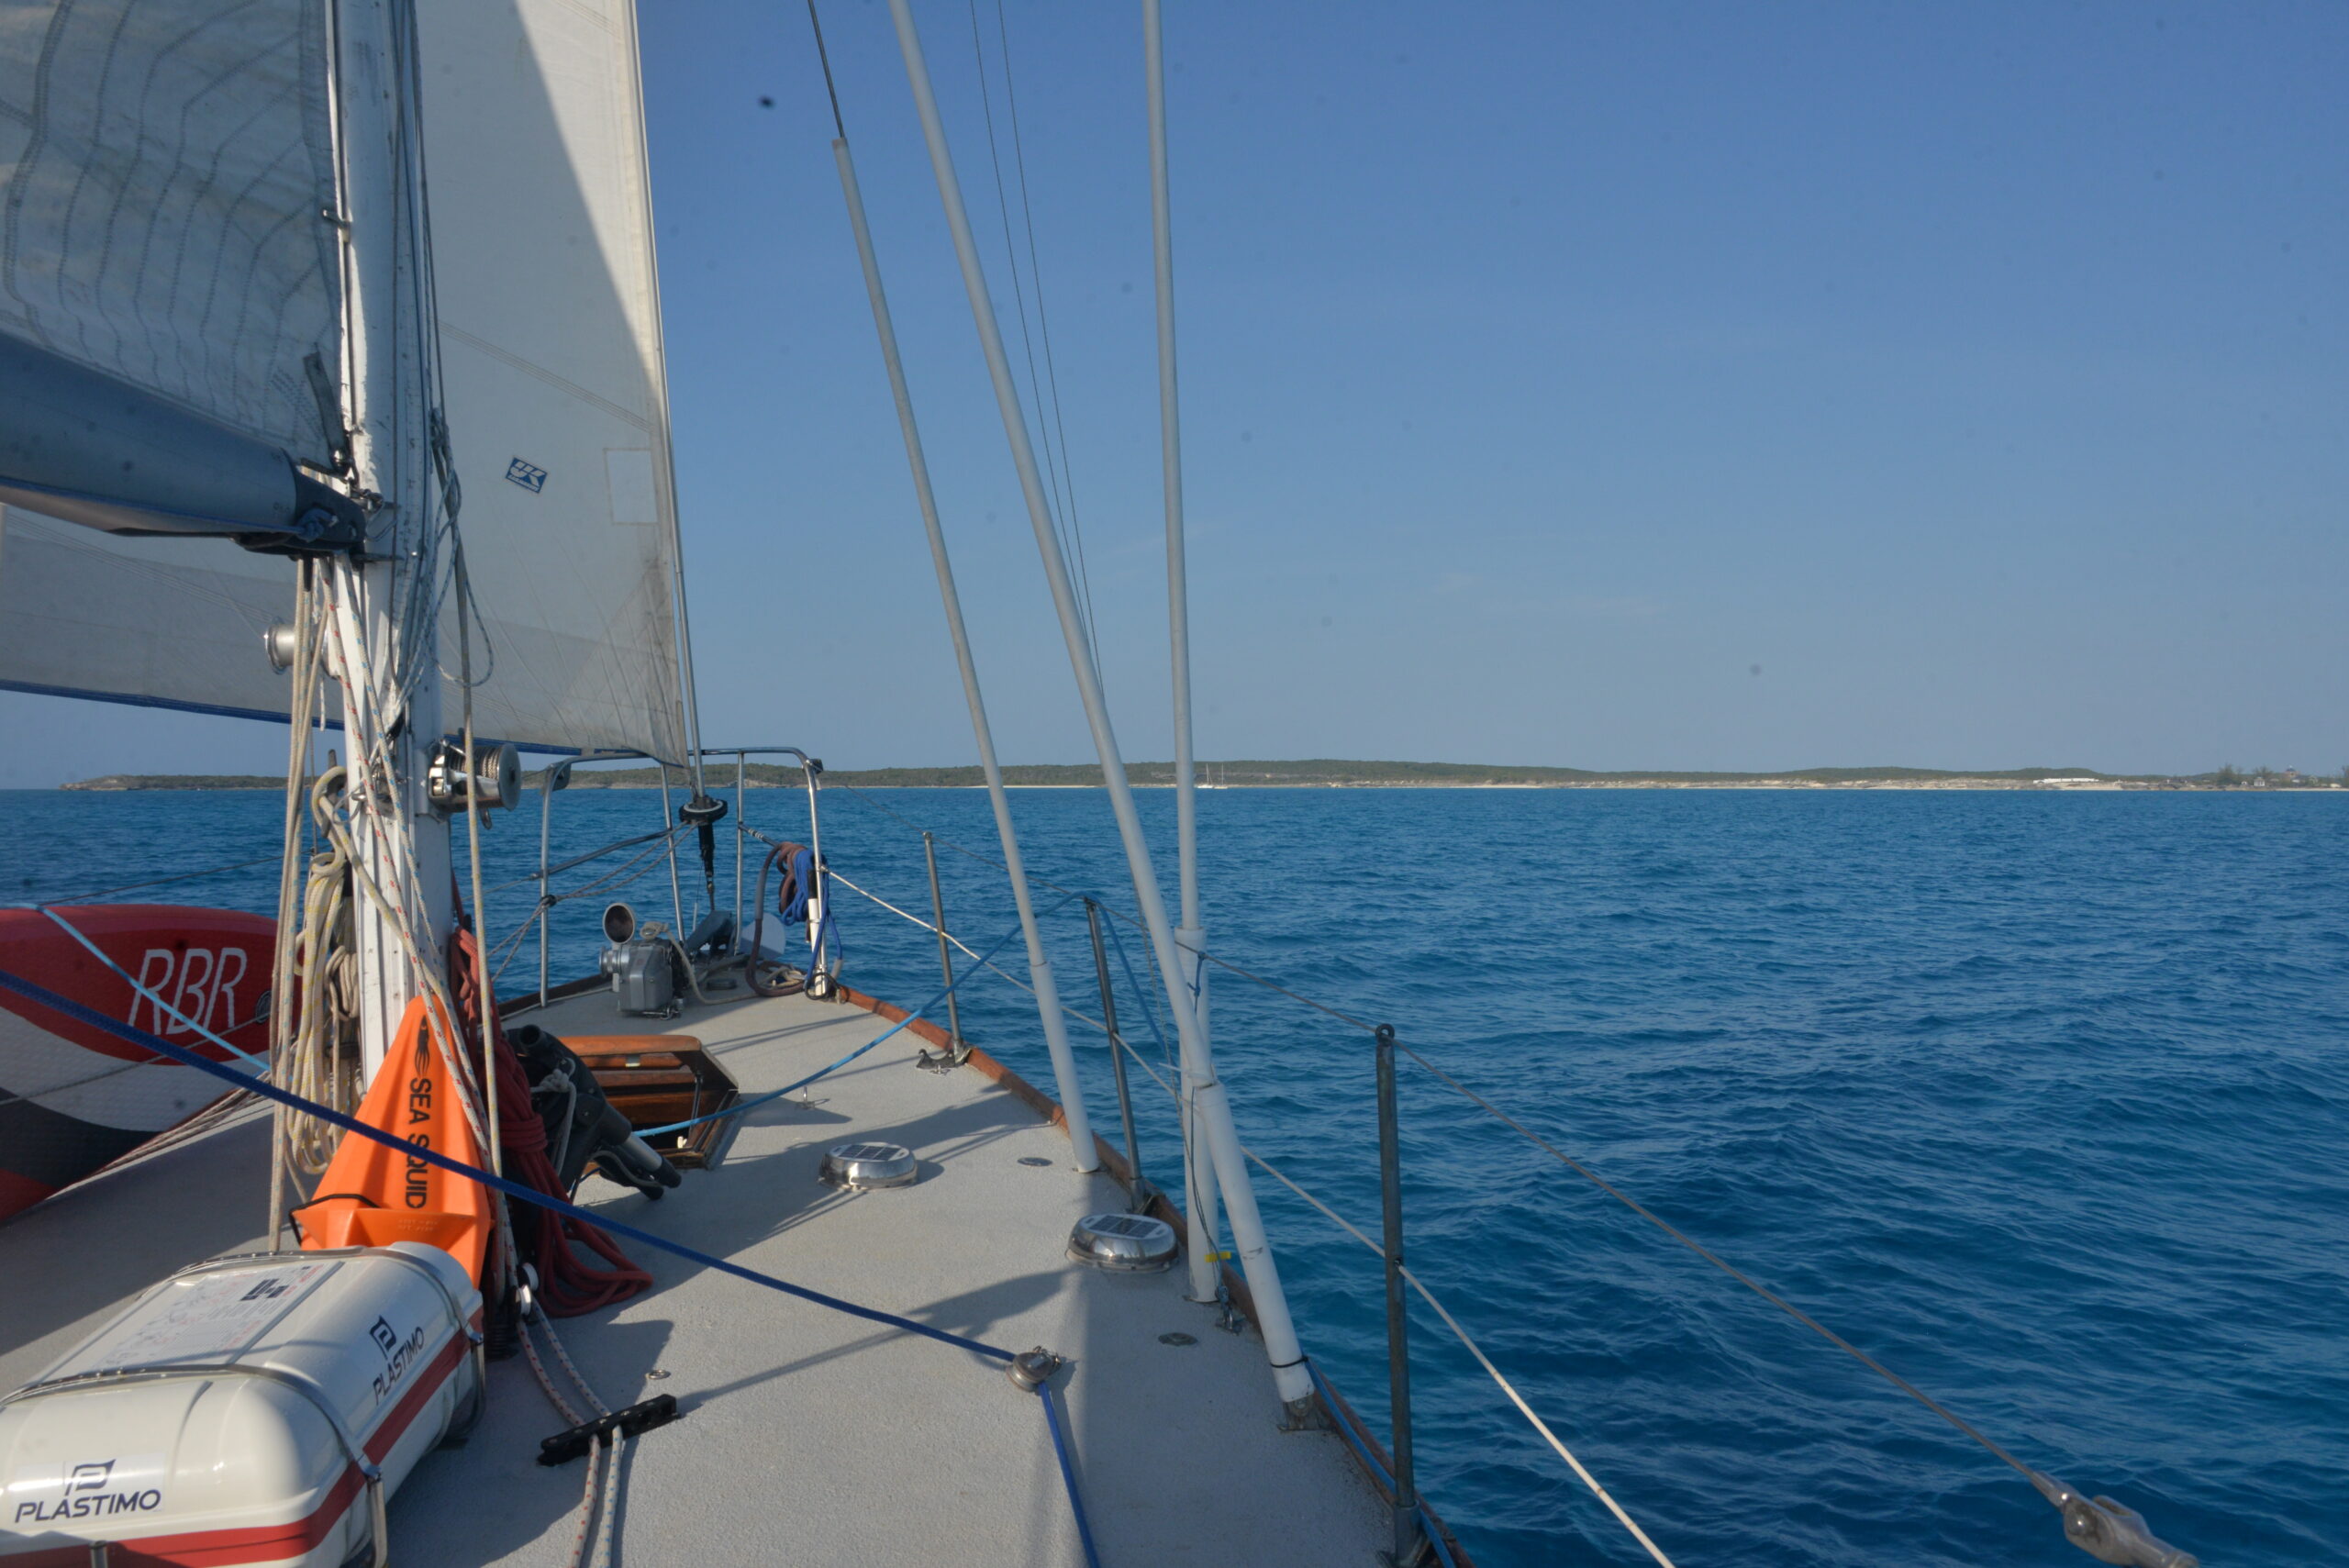
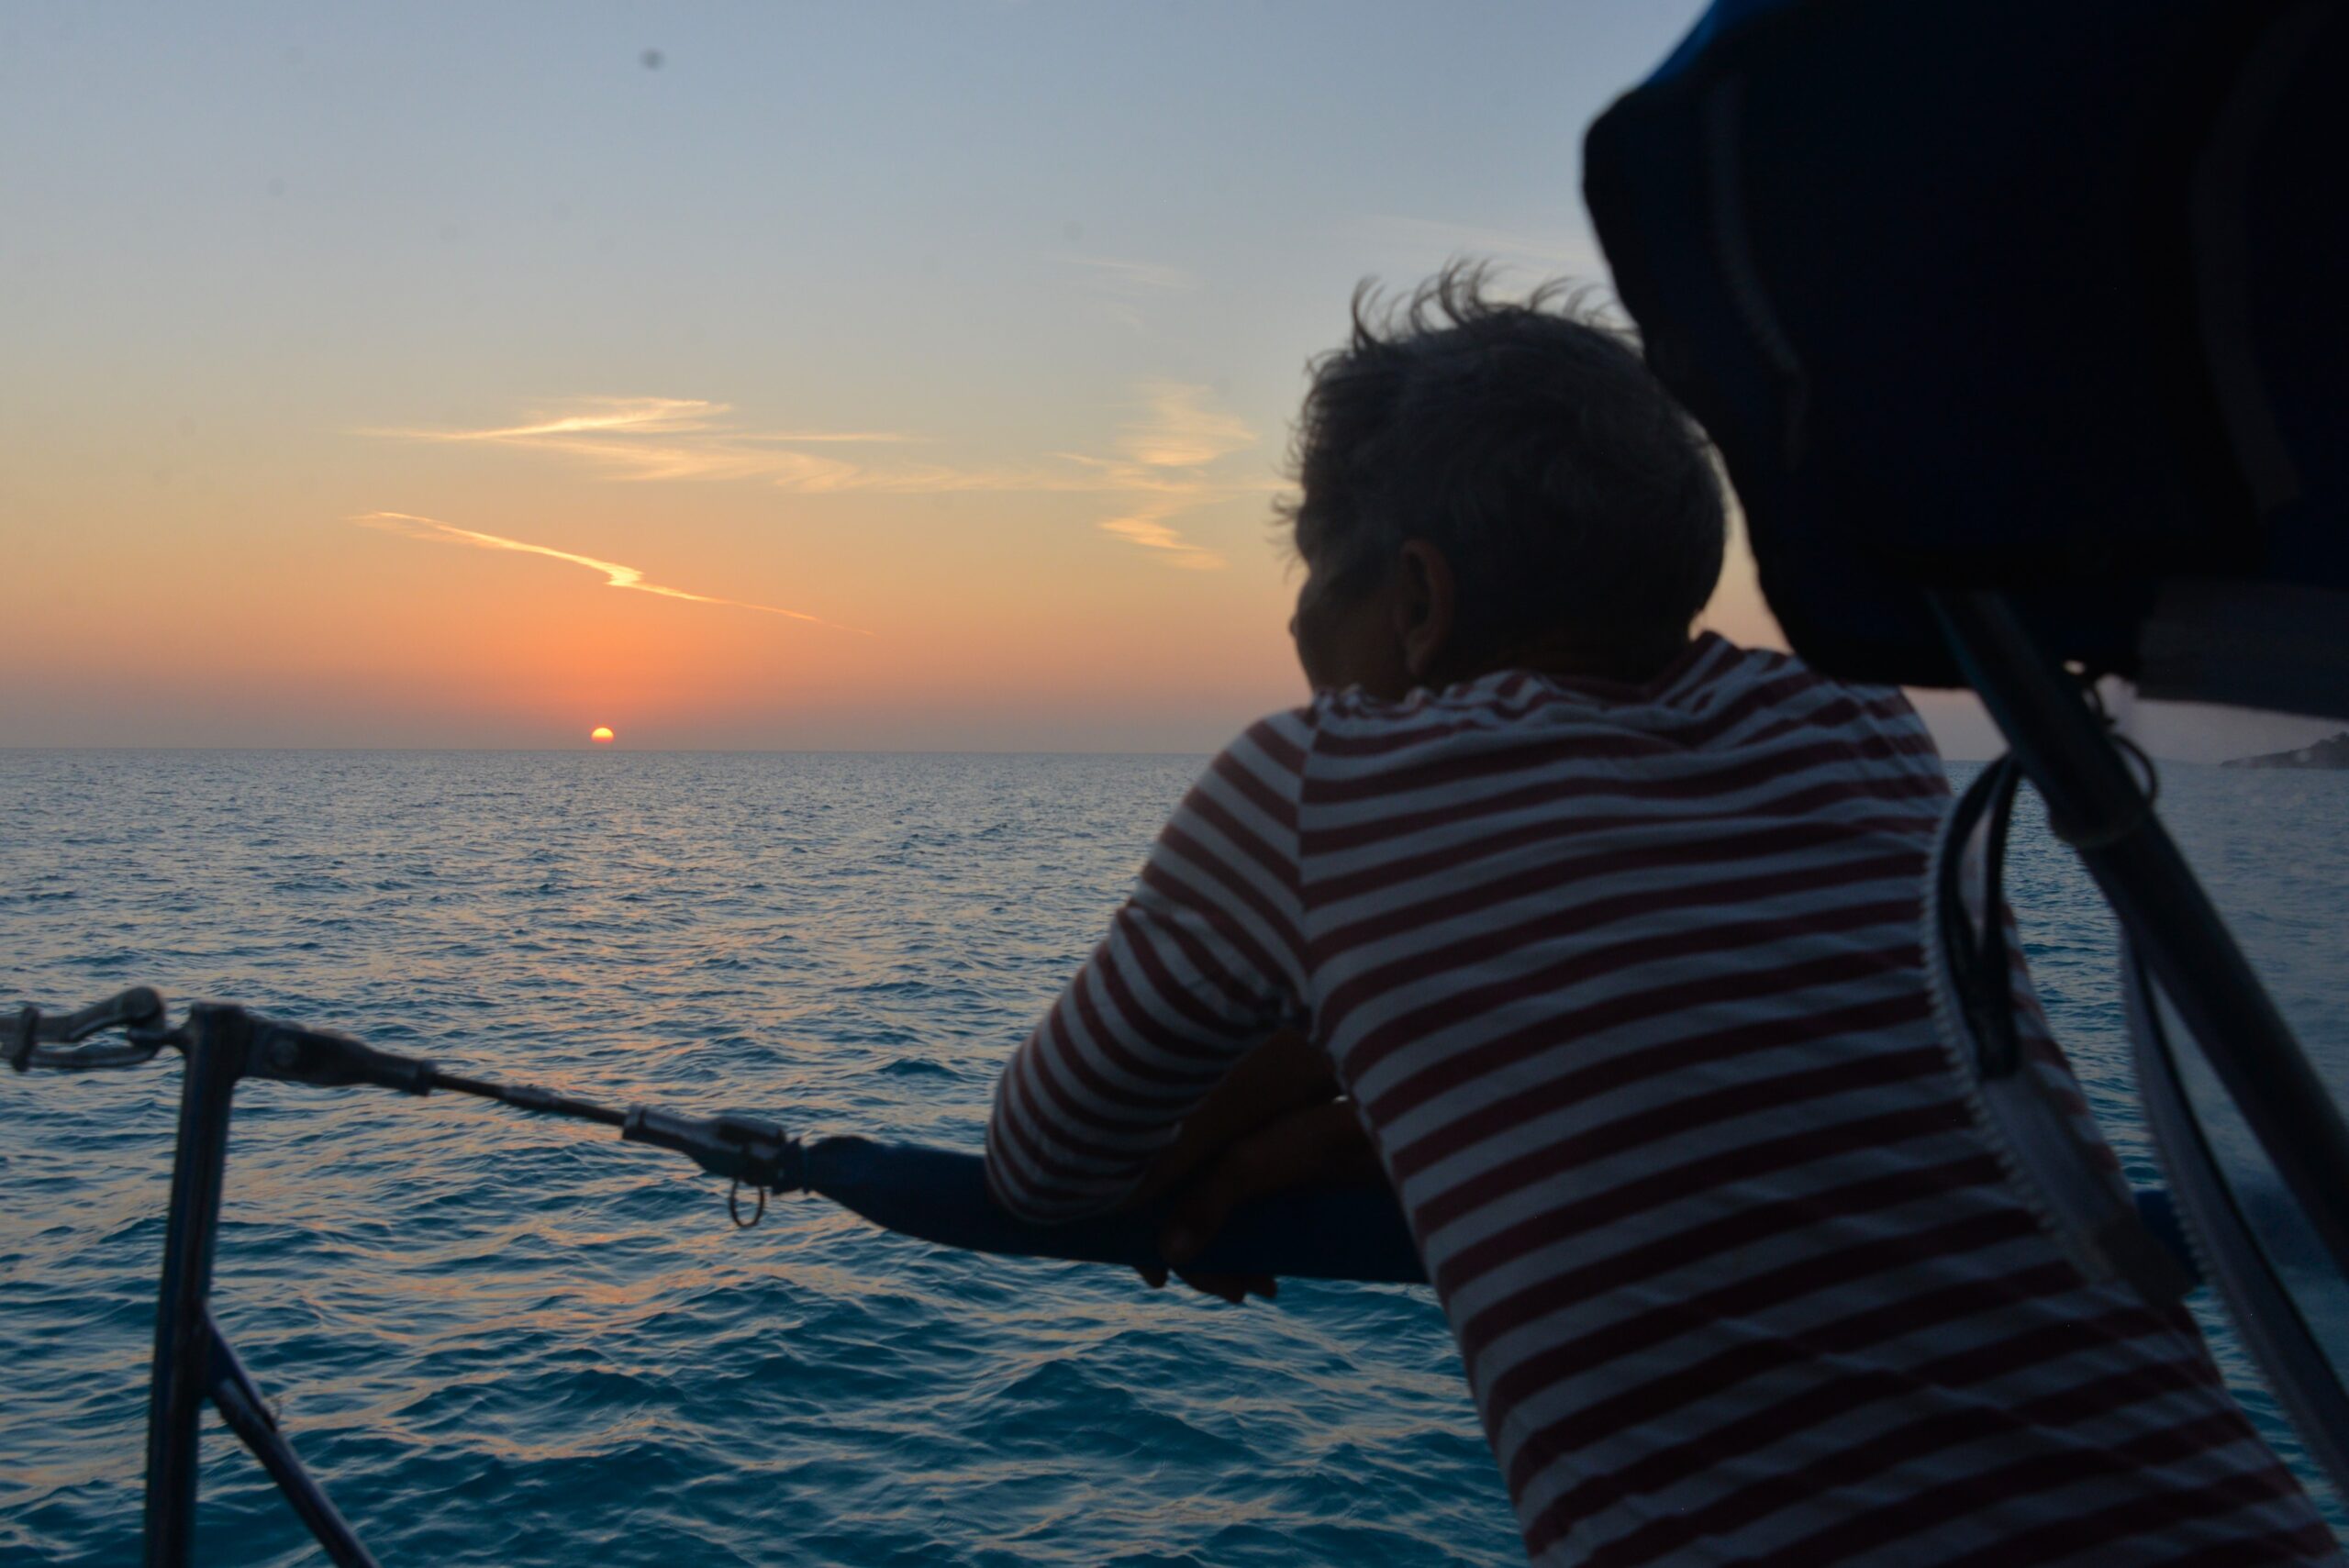
After lounging around George Town for what felt like a never-ending vacation (thanks, weather and boat troubles!), and bidding farewell to our son Yaroslav (who finally decided he had enough of our salty adventures and headed home), we decided it was time to bid adieu to the cozy confines of Elizabeth Harbor and its great boaters community. Off we sailed towards the mystical Long Island, with its majestic northern Cape Santa Maria. Legend has it that Christopher Columbus himself christened this cape back in 1492, inspired by one of his trusty ships. Our voyage spanned a mere 30 nautical miles, during which we fancied ourselves as seafaring pros, making not one, but two CTD casts along the way. As dusk descended upon us, we reached our destination, dropped anchor, had a dinner and plotted our grand expedition for the next day: the daring exploration of Cap Santa Maria. Let the adventure begin!
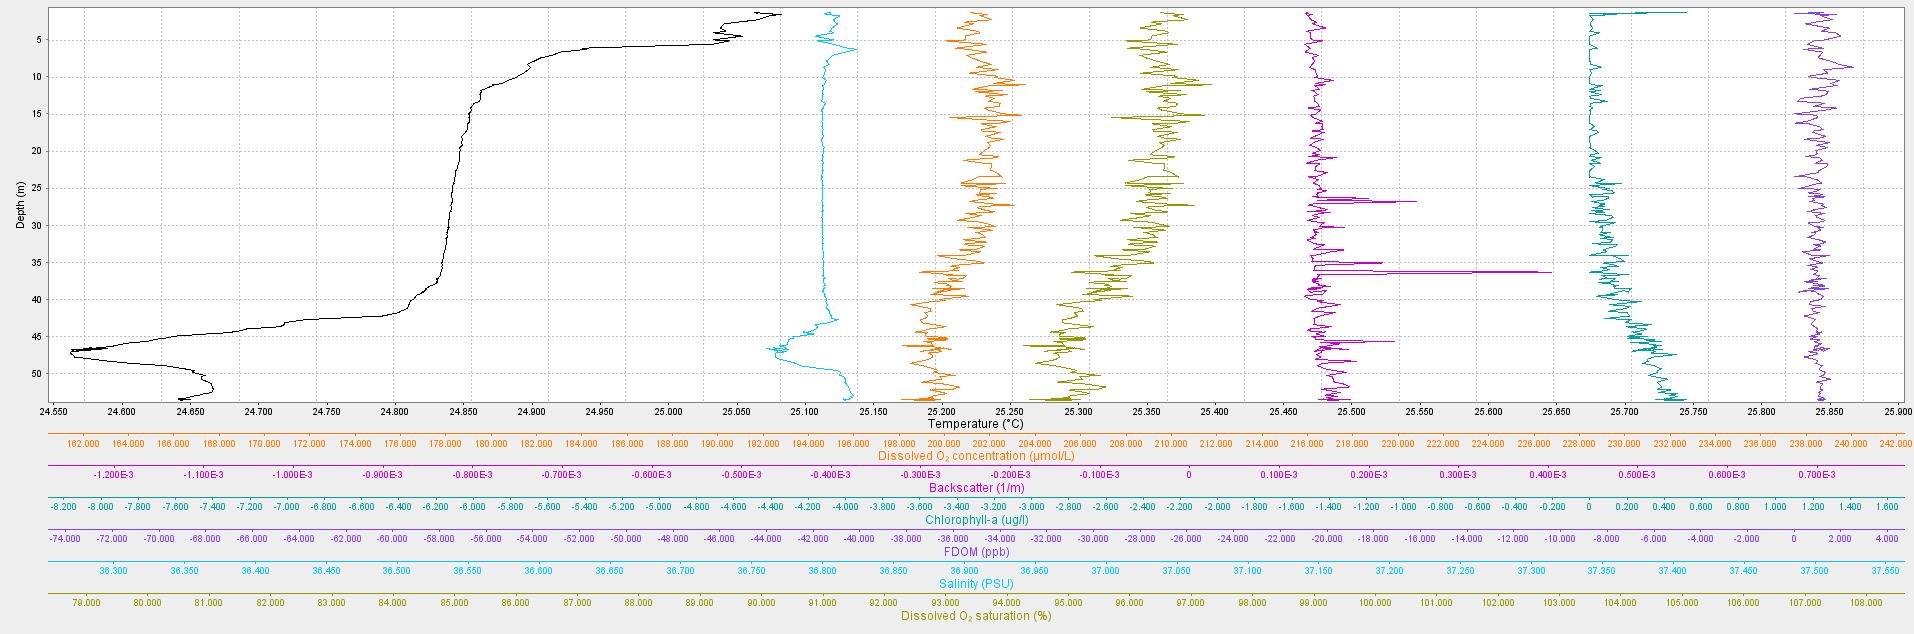
The T profile is a striking difference from the cast you recently shared on youtube!
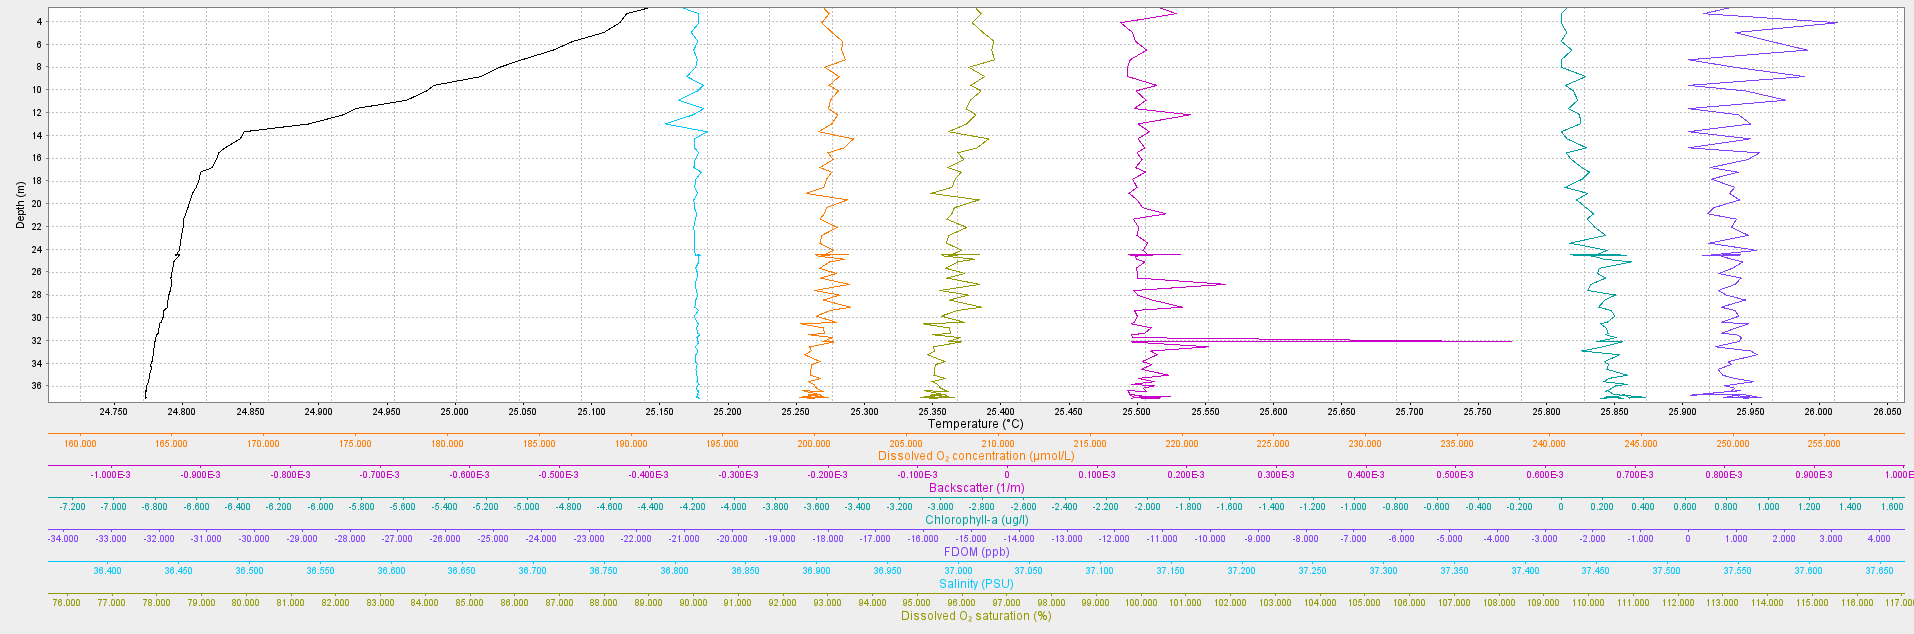
Yes, Yuri, these casts were done by CTD’s reaching depths down to 35-50m on 1-2knots moving boat in deep ocean (~1000m depth). We can see some temperature stratification, caused by tidal current and wind-driven mixing near surface. On video we were anchoring in Elizabeth Harbor (George Town) with only 5m depth, which well mixed down to the bottom by current and wind, really, no stratification.
Thanks for the explanation Igor.
I should have known better than to post such a silly comment )))
And yet by way of critique the axes on your plots are not well seen, which is why I assumed that the casts are comparable.
Assumptions cause problems…
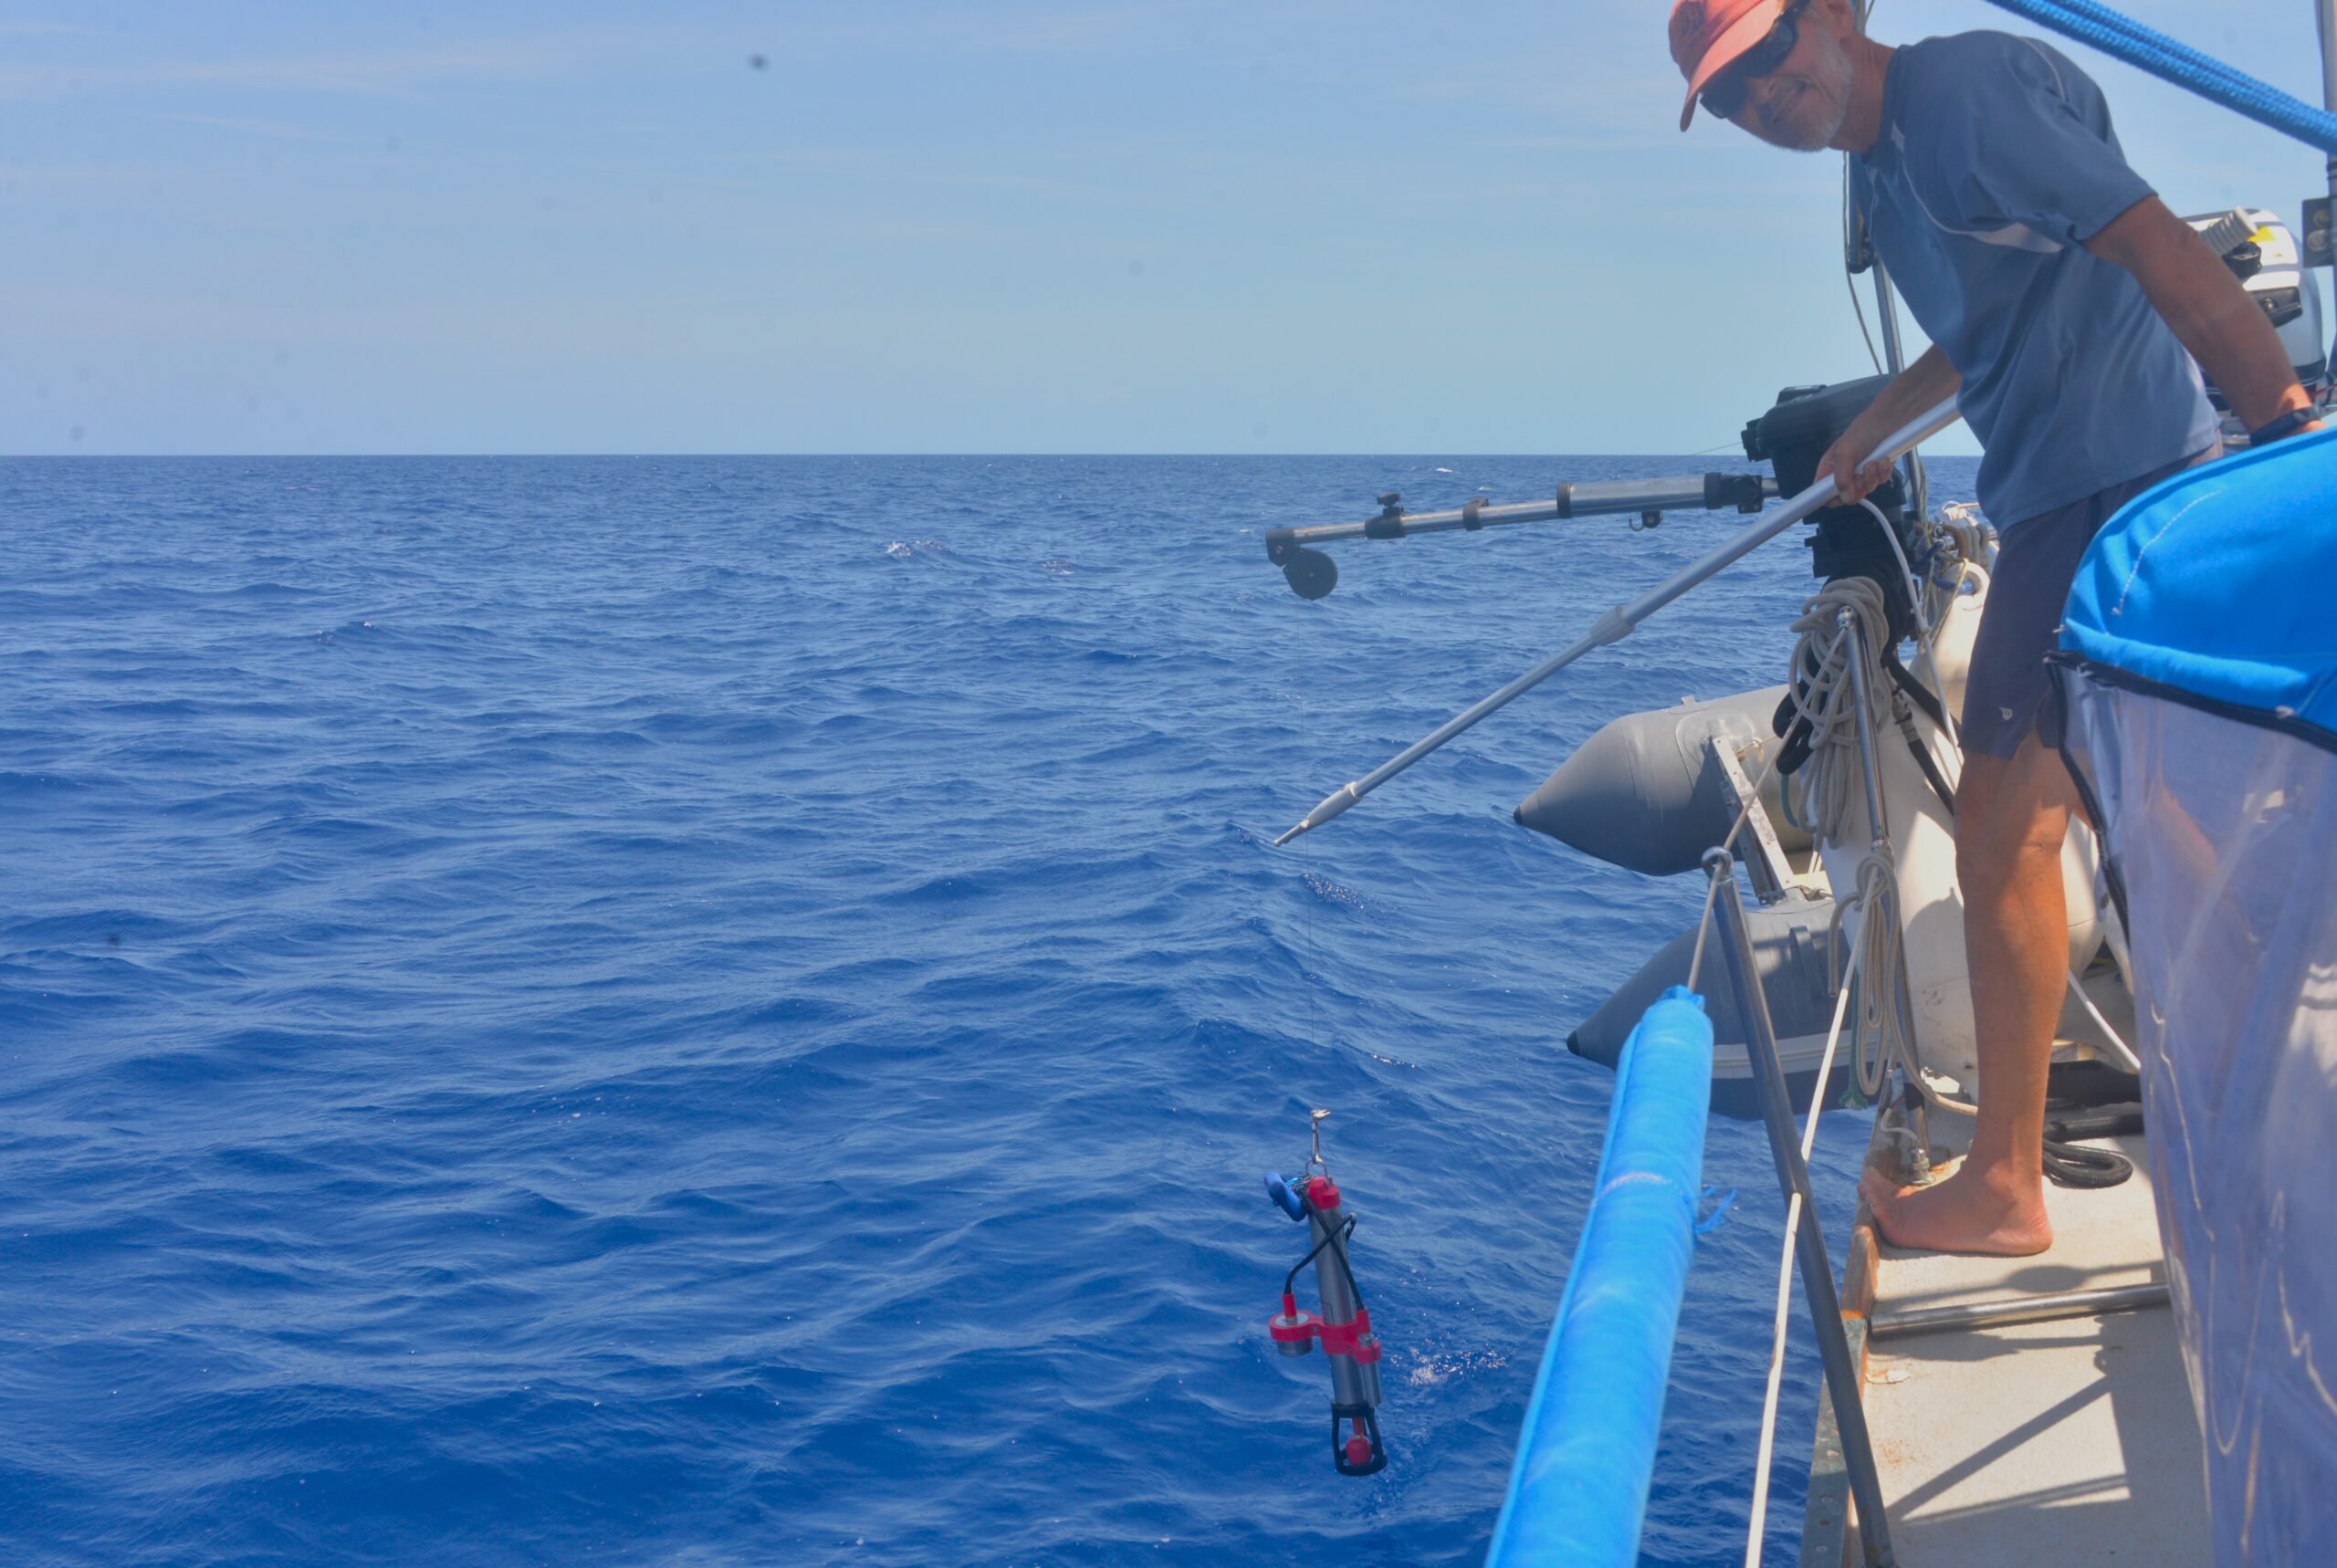
Sorry for that, Yuri. I agree that fonts on axes are not well seen – I use RBR Ruskin software to plot raw data and can’t change it setting. Hope I will move to post-processing and plots with Python. Also, to reduce assumptions, I should announce that I started profiling deeper with introduction of an electrical winch.